

U.S. & Canadian stocks · Updated every trading day
Find stocks that are spiking. gapping up. trading sideways. breaking out. reversing. making news.
7-day free trial · No credit card required
Our reports cover 8000+ stocks from the major North American Stock Exchanges
- Advanced Screeners Filter every U.S. and Canadian stock your way. Try it →
- News Catalysts Stocks moving on mergers, FDA news, buyouts and more. Try it →
- Candlestick Patterns Engulfing, hammer, harami and more, found daily. Try it →
- Spikes Unusual jumps in price and volume. Try it →
- Sideways Stocks trading in a tight range. Try it →
- Breakouts Stocks breaking out of their range. Try it →
- Performance Tracker Top gainers and losers by week, month and year. Try it →
-
Automated Signals Signals from crossovers, range limits and other indicators.
Features Our Members Love
- Historical Gainers Travel back two years See each day's top 100 gainers and losers, and how they did a day, a week or a year later. Open Historical Gainers
- Gaps Catch the gappers Stocks that opened above or below the previous day's range, with full and partial gaps. Open Gaps
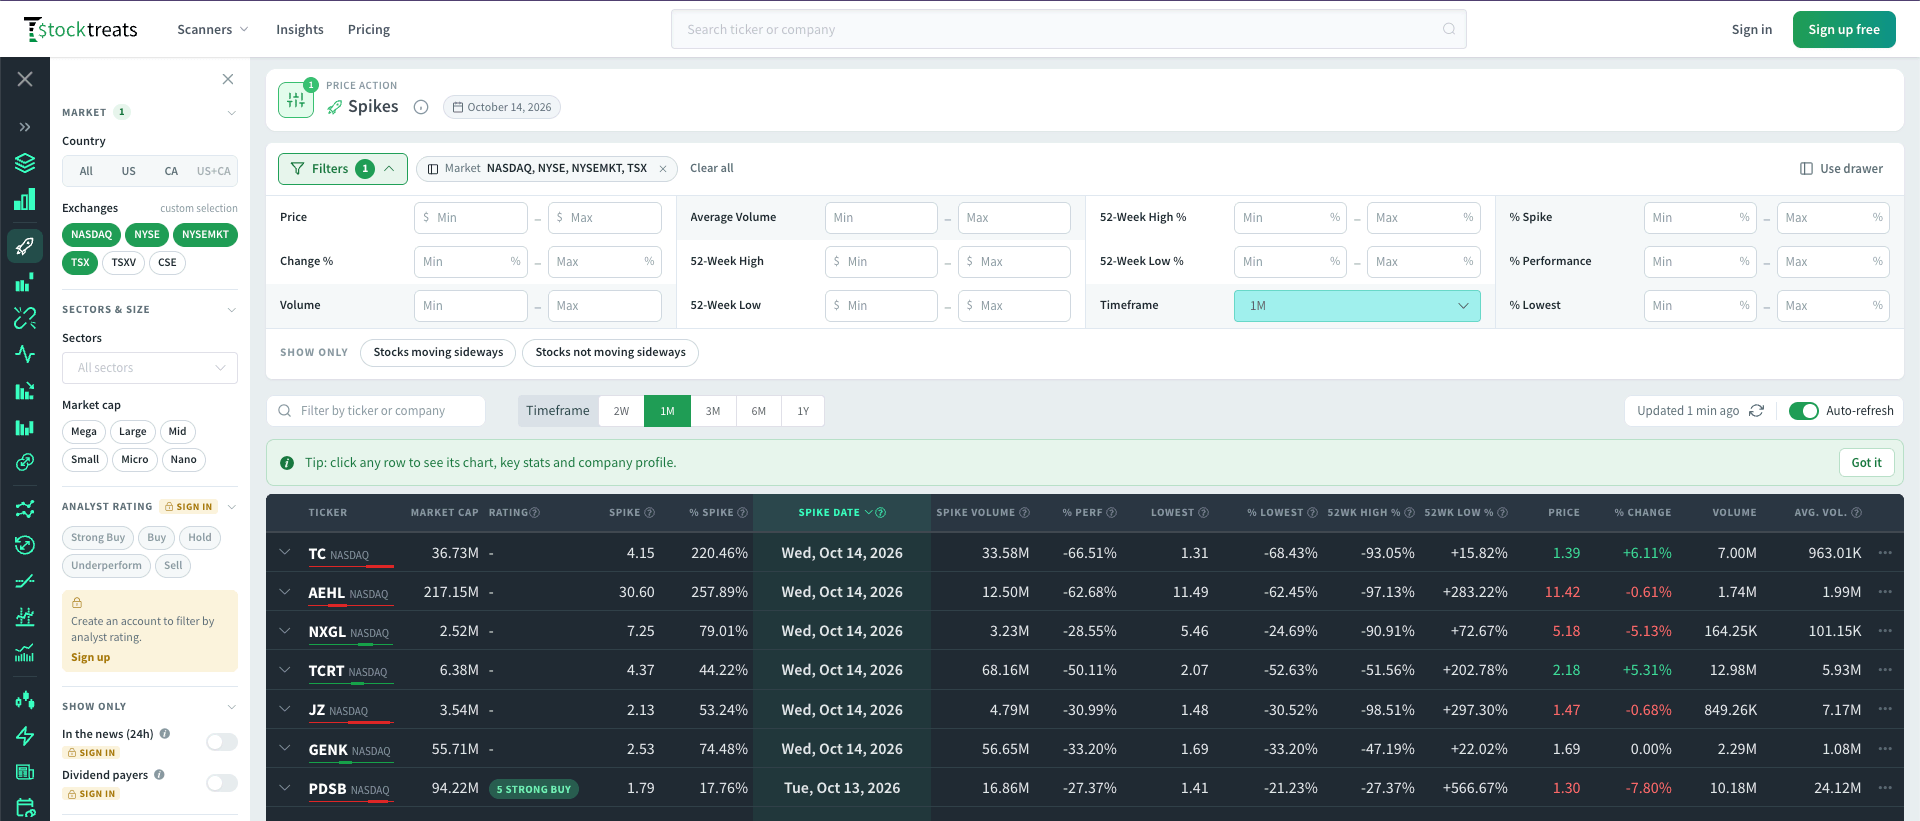
- Spikes Spot unusual moves Sudden jumps in price and volume, and whether they held. Open Spikes
- Performance Tracker Find hidden winners Weekly, monthly and yearly gainers you've probably never heard of. Open Performance Tracker
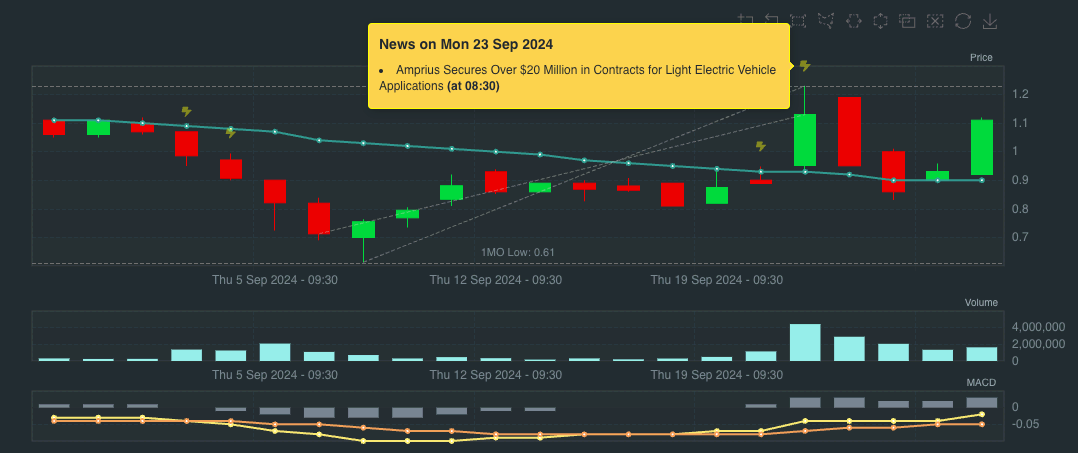
See the news behind every move
Headlines appear right on the price chart, at the moment they hit. No more switching tabs.
- 5D to 1Y
- Daily candles
- Every U.S. & Canadian stock
How it Works
After every trading day, we go through each U.S. and Canadian stock and sort it into lists: spikes, gaps, sideways ranges, reversals, new highs and lows, and more. Each list covers several timeframes, from 5 days to 1 year.
You get a short list of stocks worth a closer look, each with its chart and recent news. We don't tell you what to buy or sell: what you do with the list is up to you.
Why Stocktreats?
Canadian small caps get the same coverage as U.S. stocks. TSX, TSX Venture and CSE stocks are scanned alongside NASDAQ, NYSE and AMEX, which most U.S. tools skip.
You can also see what happened next. Historical Gainers shows how two years of daily top movers did a day, a week and a year later, and Spikes shows whether each move held.

Lot of features to optimize the time you spend researching stocks.
We aim at providing stock trading indicators and insights for beginners or experienced traders and investors. Our goal is to keep it simple but comprehensive.
Historical Gainers/Losers
Go back in time (up to 2 years) to see each day's top gainers/losers and backtest like a pro.
Spikes
The Spikes scanner detects large upward movement of price and volume in a single day or a short period of time.
Gaps
The Gaps scanner detects up & down gaps.
Sideways
The Sideways scanner monitors horizontal price movements between levels of support and resistance.
Breakouts
Special screener for stocks that moved outside their sideways zone, breaking resistance or support
Dips And Crashes
Monitor stocks that have declined in price in a period or a single day, and take advantage of eventual upswing.
Reversals
Monitor bullish & bearish reversals. This feature is geared more toward low price stocks and day/swing trading strategies.
Moving Average Crossovers
Discover stocks that have just broken their Moving Average (MA) in the previous session.
Performance Tracker
Track gainers and losers over time. Discover growing stocks you've probably never heard of.
Candlestick Stats
The Candlestick Stats tool reports the percentage of upward vs. downward movements for a timeframe.
New Highs/Lows Momentums
The Momentums scanner reports new highs, intraday highs, new lows and intraday lows.
Candlestick Patterns
Screener for various bullish and bearish candlestick patterns (Engulfing, Piercing, Harami, etc.).
News Catalysts
We aggregate and classify news headlines to keep you informed of eventual catalysts.
Media Coverage
We provide daily, bi-weekly and monthly media coverages to allow you to identify stocks that are trending in the news.
Earnings Calendar
Earnings Calendar is a useful tool to track upcoming financial results, in order to conduct trade planning.
Volatility Ranker
The Volatility Ranker, helps you identify volatility gainers/losers. Volatility are based on peaks and valleys of close prices

Get control
Stay on top of your trades and investments
Take control over the vast universe of US and Canadian stocks. Our reports cover the major North American stock exchanges (NASDAQ, NYSE, AMEX, TSX, TSXV, CSE)
Leverage our advanced and flexible screeners to plan your trades and investments.
Unlimited and super-powered watchlists to keep track of the stocks you want to investigate.
Get notified! Setup personalized alerts to keep you on top of potential buy or sell signals.
Manage your personal holdings and monitor the performance of your investments.