Unlocking Insights, Empowering Trades: Your Ultimate Stock Picking Companion!
Here's What Stocktreats Is About.
We crafted StockTreats with the aim of simplifying price action analysis while ensuring its comprehensiveness for traders.
How it Works
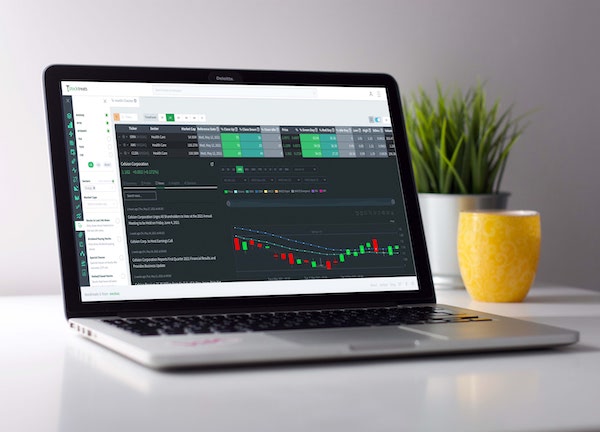
We analyze market dynamics with a focus on end-of-day price actions, meticulously scanning each stock for distinctive patterns such as spikes, sideways movements, reversals, new highs/lows etc. across various timeframes (5D, 2W, 1M, 3M, 6M, 1Y). Utilizing cutting-edge technologies and proprietary algorithms, our advanced stock screeners deliver unparalleled accuracy in detecting patterns and classifying stocks.
While we refrain from offering explicit buy/sell recommendations, our commitment is to empower you with a wealth of patterns and insights. By providing a rich tapestry of data, we aim to streamline your stock discovery process, enabling you to make well-informed decisions faster and with confidence.
A data-driven approach is an indispensable tool for investors aiming to thrive in the competitive and ever-evolving landscape of the stock market. By harnessing the power of data and customizable features, investors can make informed decisions, stay ahead of market trends, and ultimately achieve their financial goals.
Every trader has a unique risk tolerance, investment horizon, and financial goal. We recognizes this diversity and allows for the customization of investment strategies.
StockTreats is geared more toward swing trading strategies. But long term traders and investors can also benefit from our innovative insights.
Ready to get started? Join the growing list of members who trust our reports!
Lot of features to optimize the time you spend researching stocks.
We aim at providing stock trading indicators and insights for beginners or experienced traders and investors. Our goal is to keep it simple but comprehensive.
Historical Gainers/Losers
Go back in time (up to 2 years) to see each day's top gainers/losers and backtest like a pro.
Spikes
The Spikes scanner detects large upward movement of price and volume in a single day or a short period of time.
Gaps
The Gaps scanner detects up & down gaps.
Sideways
The Sideways scanner monitors horizontal price movements between levels of support and resistance.
Breakouts
Special screener for stocks that moved outside their sideways zone, breaking resistance or support
Dips And Crashes
Monitor stocks that have declined in price in a period or a single day, and take advantage of eventual upswing.
Reversals
Monitor bullish & bearish reversals. This feature is geared more toward low price stocks and day/swing trading strategies.
Moving Average Crossovers
Discover stocks that have just broken their Moving Average (MA) in the previous session.
Performance Tracker
Track gainers and losers over time. Discover growing stocks you've probably never heard of.
Candlestick Stats
The Candlestick Stats tool reports the percentage of upward vs. downward movements for a timeframe.
New Highs/Lows Momentums
The Momentums scanner reports new highs, intraday highs, news lows and intraday lows.
Candlesticks Patterns
Screener for various bullish and bearish candlesticks patterns (Engulfing, Piercing, Harami, etc.).
News Catalysts
We aggregate and classify news headlines to keep you informed of eventual catalysts.
Media Coverage
We provide daily, bi-weekly and monthly media coverages to allow you to identify stocks that are trending in the news.
Earnings Calendar
Earnings Calendar is a useful tool to track upcoming financial results, in order to conduct trade planning.
Volatility Ranker
The Volatility Ranker, helps you identify volatility gainers/losers. Volatility are based on peaks and valleys of close prices